
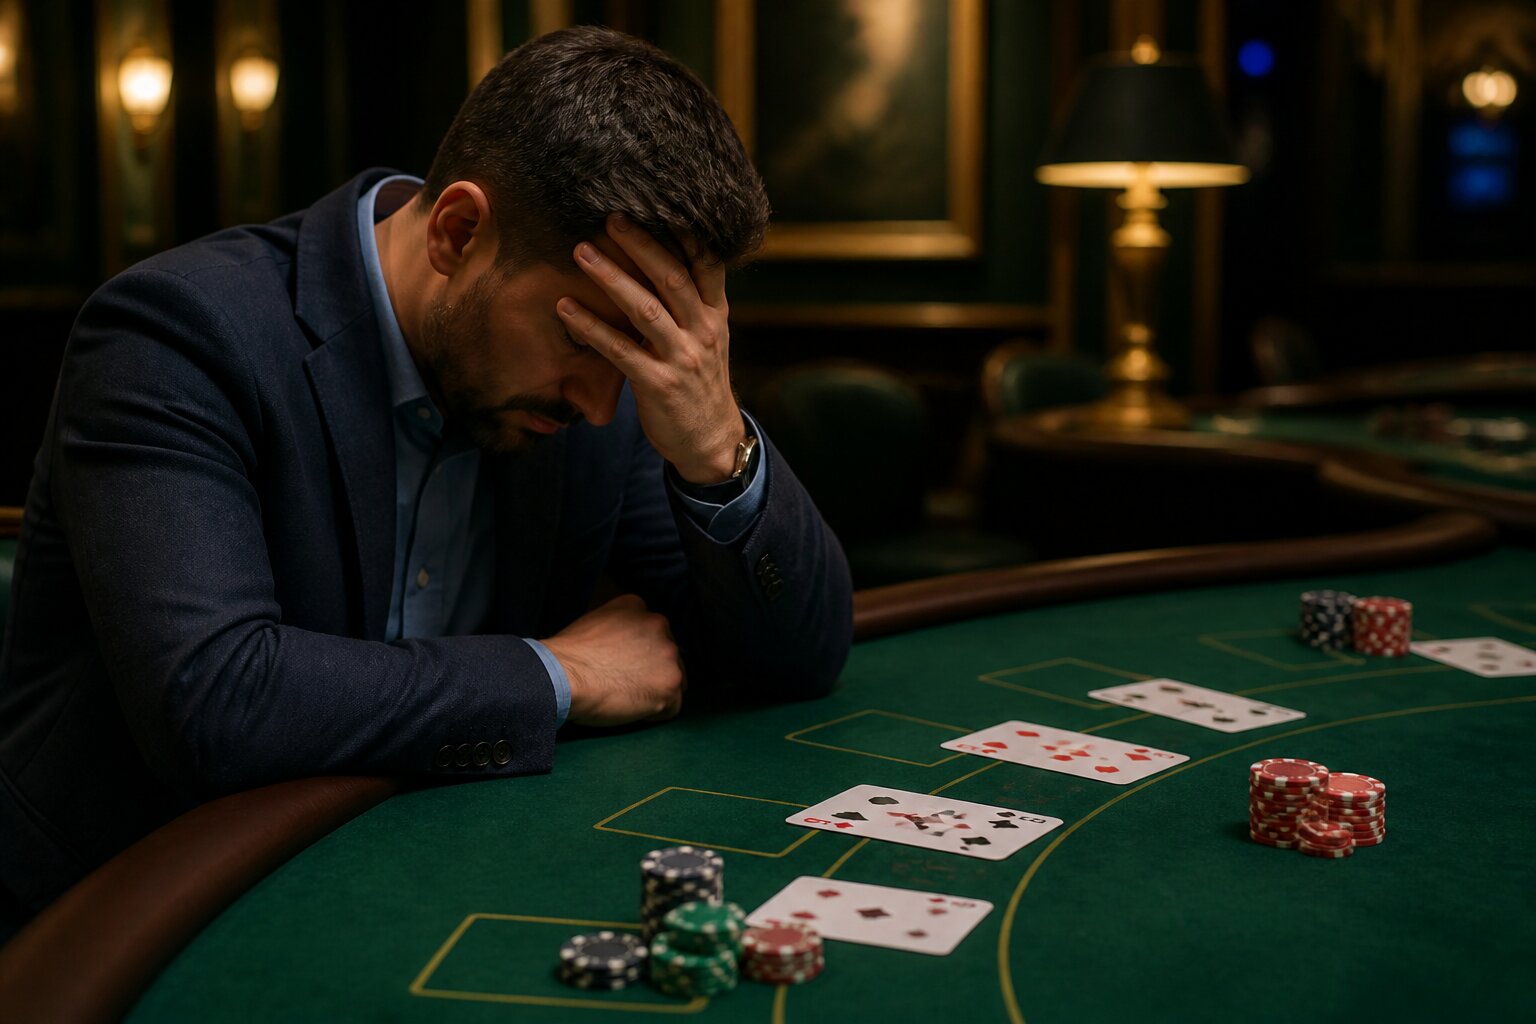
Many players have wondered how likely a long losing run is at the blackjack table. Understanding the chances of consecutive losses helps set realistic expectations and keeps sessions clearer and less stressful. Whether you play occasionally or regularly, the numbers behind streaks are straightforward once you know how probability works.
Curious about the real chances of losing multiple hands back-to-back? Read on for clear explanations, useful examples and the stats that matter for common scenarios.
Understanding Probability in Blackjack
In blackjack, probability describes the chance of a particular outcome in any single hand, such as a win, a loss, or a push. Each round is an independent event: the cards dealt in one hand do not change the mathematical chances in the next. This independence means outcomes are calculated hand by hand, not as part of a chain that the game “remembers”.
Typical single-hand figures under standard rules and correct basic strategy place the chance of losing a hand at just under 50%, commonly around 48%. That percentage reflects all possible outcomes—dealer blackjacks, player busts, pushes and player blackjacks—and assumes statistically optimal decisions by the player.
Because every hand is fresh, the probability of several losses in a row is found by multiplying the single-hand loss probability by itself for each successive hand. For instance, a two-hand losing run is the single-hand probability squared. That multiplication rule is the backbone of the calculations that follow, so keep it in mind as we look at concrete numbers and what they mean for your play.
How Do Blackjack Losing Streaks Happen?
Losing streaks emerge from variance, the natural fluctuation between wins and losses inherent in any game with uncertainty. Even with solid strategy, a player can encounter short runs of losses because of how cards fall and how outcomes interact—dealer blackjacks, pushes that convert potential wins into neutral results, or hands where the player busts while the dealer reaches a strong total.
Consider a player who uses correct basic strategy: they will still experience runs of three or four losses simply because the distribution of outcomes sometimes clusters. This clustering is not a reflection of skill in that moment but of statistical dispersion; it is the same phenomenon that produces runs of wins as well. Recognising that variance is a normal part of play helps manage expectations and betting choices.
One practical consequence is that even modest differences in game rules or deck composition can alter how often negative runs appear over many hands. We’ll explore those rule effects shortly, but first we’ll show the exact maths behind losing streak probabilities so the scale of those runs becomes clear.
What Are the Exact Odds for Losing Consecutive Hands?
The mathematics behind consecutive losses is straightforward: treat each hand as an independent event and multiply the single-hand loss probability for each additional hand in the sequence. Using the common estimate of a 48% chance to lose one hand, the following calculations illustrate how the probabilities shrink as the streak length increases.
Calculating the Maths Behind Losing Streaks
Probability of losing a single hand: 48% (0.48 as a decimal).
Multiply 0.48 by itself for each extra hand to get the chance of a run of that length.
Here are some example results using 48% as the single-hand loss probability:
- Two consecutive losses: 0.48 × 0.48 = 0.2304 (23.04%).
- Three consecutive losses: 0.48^3 = 0.1106 (11.06%).
- Four consecutive losses: 0.48^4 ≈ 0.0531 (5.31%).
- Five consecutive losses: 0.48^5 ≈ 0.0255 (2.55%).
- Six consecutive losses: 0.48^6 ≈ 0.0122 (1.22%).
- Seven consecutive losses: 0.48^7 ≈ 0.0059 (0.59%).
- Eight consecutive losses: 0.48^8 ≈ 0.0028 (0.28%).
These figures show that short losing streaks are reasonably common, while longer runs become progressively rarer. The same multiplication rule applies if you use a different single-hand loss percentage; changing that base value yields the corresponding sequence probabilities. With those maths in mind, it’s useful to consider how the playing environment—for example, online versus physical tables—can affect the single-hand figures that drive these sequences.
Comparing Online and Land-Based Blackjack Odds
The basic per-hand probabilities that produce losing streaks are similar online and in physical casinos because both formats adhere to the same game mechanics. Nevertheless, small differences in rules and dealing methods can nudge the single-hand figures, which in turn changes streak probabilities over time.
Online games often use random number generators to produce independent hands and may offer rules that slightly favour the player, such as dealers standing on soft 17 or permitting doubling after splits. These rule sets can lower the house edge and thereby reduce the single-hand loss probability a little. Live-dealer online tables use real cards and tend to match the dynamics of a bricks-and-mortar table more closely, so their statistics are closer to land-based outcomes.
Physical casinos might use multiple decks, continuous shuffling machines, or different blackjack payouts. For example, a reduced blackjack payout increases the house edge and so raises the long-term likelihood of losses; multiple decks can also change the distribution of possible outcomes. Speed of play is another factor: online sessions often produce more hands per hour, which makes streaks appear more frequently simply because more hands are being dealt.
Small rule differences matter because they change the single-hand baseline that the streak calculations multiply. In the next section we'll address common mistaken beliefs about streaks and explain why those beliefs do not alter the underlying maths.
Common Myths About Blackjack Losing Streaks
A frequent misconception is that certain seats or tables bring better runs of cards; in reality, position does not change the mathematics of each independent hand. Another is the tendency to expect a reversal after a series of losses—a version of the Gambler’s Fallacy. Believing that past outcomes force future ones confuses correlation with causation and leads to misleading expectations.
Many players also trust betting systems that claim to avoid or overcome losing runs. Systems that alter bet size do affect the rate at which money is won or lost, but they do not change the probability that any given hand will end in a loss. Over time the house edge embedded in the rules will determine the expected result, independent of how bets are structured.
Understanding these myths helps keep decisions grounded in reality rather than in patterns that do not exist. With the myths dispelled, it is worth looking at the structural factors—like rules and house edge—that genuinely influence the single-hand probabilities behind streaks.
How Do House Edge and Game Variations Influence Your Chances?
The house edge quantifies the casino’s long-term advantage and is shaped by rules such as deck count, blackjack payout, dealer actions on soft 17, and options for doubling or splitting. Each of these elements adjusts the single-hand odds that, when multiplied, produce the probabilities of consecutive losses.
A single-deck game paying 3:2 for blackjack and allowing classic player options typically produces one of the lowest house edges, often around 0.5% with optimal strategy. In such games, the single-hand loss probability is marginally reduced, making short losing streaks a touch less frequent over many hands. By contrast, games that use six or eight decks or reduce blackjack payouts to 6:5 increase the house edge, which raises the expected frequency of losses and lengthens the time it takes, on average, to recover from negative runs.
Even seemingly minor rule changes, like whether the dealer hits or stands on a soft 17, have measurable effects on expected return and therefore on the probabilities that feed streak calculations. Recognising how these structural choices influence the single-hand baseline will help when comparing games or deciding which tables to play, since the maths of streaks merely amplifies those baseline differences.
In summary, losing streaks are a natural result of independent hand probabilities and variance. Short runs are common, long runs are unlikely, and small changes in rules or deck composition adjust the base odds that determine how often streaks occur. If you choose to play, pick games and rules that offer the most favourable mathematical conditions and make decisions that align with your goals for entertainment and bankroll management.
Enjoy Casino Entertainment at New Online Slots
Step into our welcoming community at New Online Slots, where you can relax and enjoy the atmosphere of genuine casino entertainment alongside fellow enthusiasts. We look forward to seeing you become part of our friendly world of players.
Getting started couldn’t be easier – just set up your account, add your preferred deposit, and you can join in the enjoyable games at your own pace. We’re here to make every visit feel inviting and fun.
**The information provided in this blog is intended for educational purposes and should not be construed as betting advice or a guarantee of success. Always gamble responsibly.